Mapping Black Austin
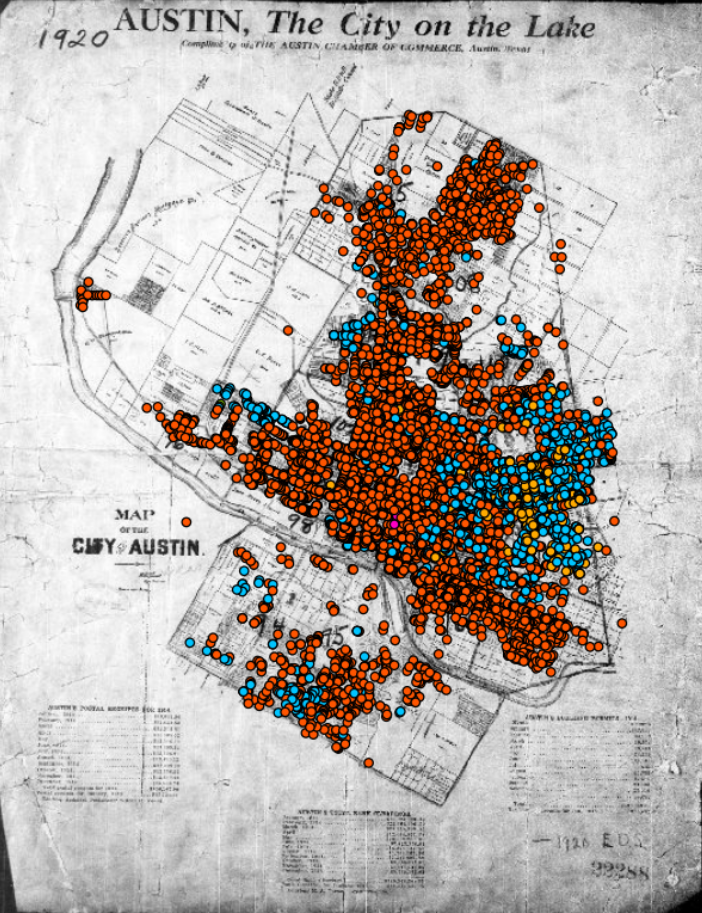
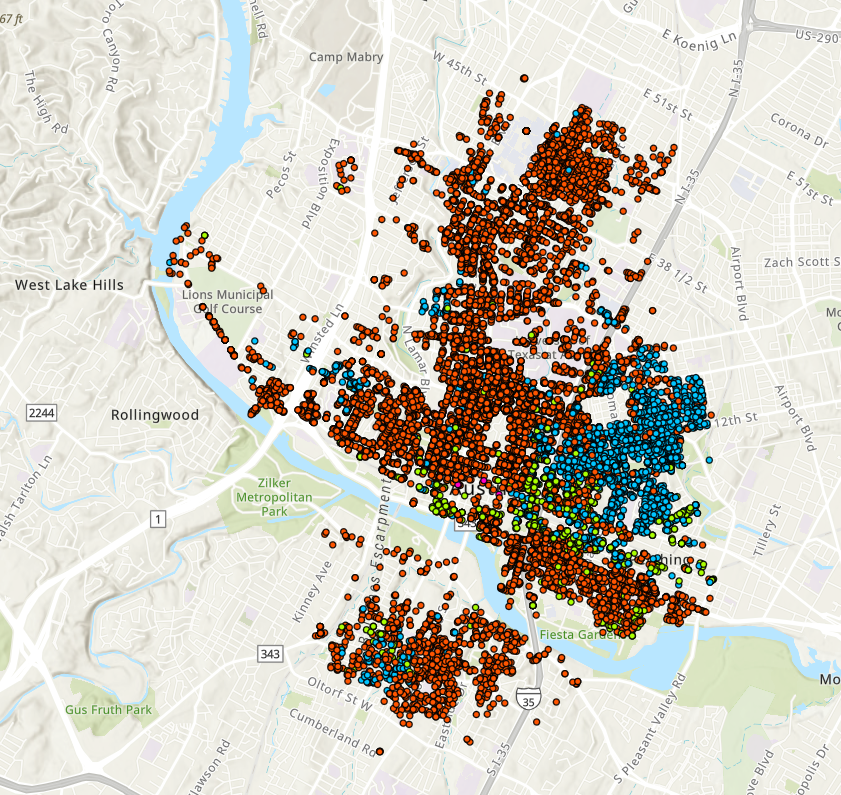
Since May 2021, I have been working with Dr. Edmund T. Gordon in the Office of Campus Contextualization and Commemoration. In this role, I have taken historic Census records and used the recorded addresses to create demographic maps of my hometown, Austin, Texas.
Project Background
Thought I joined this project a little over a year ago, it actually began in 2018. Initially, Dr. Gordon and another research assistant were investigating Wheatville, a historic freedperson’s community in the West Campus area. That research assistant created a series of maps (spanning from 1880-1940) depicting that area.
When I was brought on in 2021, I developed a program that sped up data collection from three weeks to just one hour. This made it much easier to map a larger area. I began mapping the East Campus area, which included a historically Black community known as ‘Felman Heights.’ After completing the maps of this area, I expanded my focus to the entire City of Austin.
In December of 2021, this project gained three more research assistants. I trained this people in the mapping methodology. Together, we completed a map of the city of Austin for the year 1920 in June 2022. We were meant to present our findings to the Austin City Council, but scheduling issues forced us to simply submit documents instead. Just last week (August 2022), we completed a demographic map of Austin for the year 1930.


Here are the interactive, online versions of these maps: 1920 1930.
Methodology
I developed a Python script that collects historic Census data and makes it into an Excel file. After the data is converted to this easily editable format, researchers go line by line, checking addresses and names for errors. We use historic data from city directories to corroborate our changes. After correcting addresses and names, we use ArcGIS Pro to ‘geocode’ addresses (make them into plottable points). We place one point for each family. Each point has a color indicating the race of the head of the family.
This work is done one Census tract at a time. Every tract is unique. Different Census years have different problems and challenges. This research project combines innovative digital techiques, like Python and ArcGIS, with traditional humanities techniques, like archival research. This mapping project’s unique methodology allows researchers to learn new skills and gain a better understanding of historic Austin.
Goals
The purpose of this project is to create a tool for researchers that want to learn more about the demographic history of Austin. Because the map shows the recorded race of city residents, it can help researchers to identify historic neighborhoods. As more maps are created, researchers can see demographic change over time in these neighborhoods. The maps can help us to understand the influence that institutions like UT Austin and the City Council had on Black neighborhoods in Austin.
This project is an outgrowth of a UT Commemoration initiative, so it also aims to commemorate historic neighborhoods and communities near the University of Texas. Demographic maps of the West Campus area, for example, can help us to see how fraternity life and student housing displaced Black residents of that area. This effort can help to educate students about where they live and what happened here before.
Future Plans
Now that the 1920 & 1930 maps are complete, there is still plenty of work to be done on the 1880, 1900, 1910, and 1940 maps. (The 1890 Census records were destroyed in a fire, and the 1950 Census records have only just been released. The former no longer exists, and the latter has yet to be transcribed.)
In addition to the creation of future maps, this project now has a sister project seeking to map the values of land owned by Black residents of Austin in 1920. This project is lead by Dr. Richard Heyman at UT Austin. He and a team of researchers have calculated the value of property owned by Black residents, and I have created maps displaying this information.
I intend to continue working on this project until I graduate in May of 2023.
Reflection
This project has been extremely educational for me. When I began this role, I had a budding role in the digital humanities. Working with Dr. Gordon has given me opportunities to put my Python skills to work, and I have also learned how to work with ArcGIS Pro and other GIS software. I have learned how to use historical records as data and how to ask historical questions.
I have also had the opportunity to lead a team of skilled researchers. This experience has given me a number of skills. First, I had to learn to create training materials. I created a series of training videos and a long, text-based guide to help new researchers learn the skills necessary to work on this project. I have learned to delegate responsibilities to different team members, and I have learned to create systems to allow people to know who is working on what.
Working on “Mapping Black Austin” has given me hard and soft skills, and I am grateful for the immense support I have received from Dr. Gordon and his team in this role.